
How to Calculate Event Check-In Stations: 3 Operational Rules to Prevent Queues
Every event organizer has encountered this bottleneck: thirty minutes before the opening keynote, shuttle buses unload hundreds of attendees at once, creating a queue that spills outside the venue. The production manager scrambles, three conflicting spreadsheet versions open on mobile devices, and attendees start their day frustrated. Learning how to calculate event check-in stations accurately is not a matter of gut feeling or guesswork. It is a straightforward operational capacity calculation based on arrival flow rates, peak arrival windows, and individual service times.
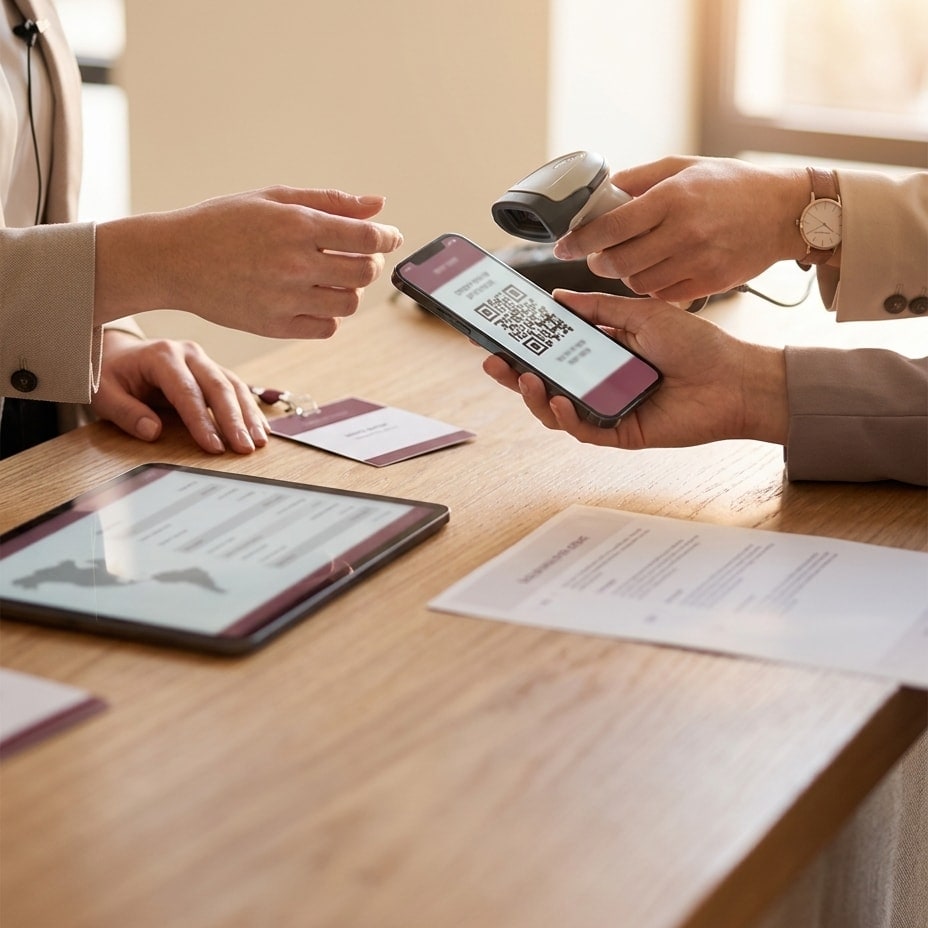
In this guide, we break down the formula for designing an efficient entrance concourse at conferences and corporate events, review three critical operational principles, and demonstrate how to balance on-site staff so no attendee waits in line for more than sixty seconds.
—
1. Peak Flow Rate and Arrival Windows
The most frequent mistake in entrance planning is dividing total registered guests evenly across the entire doors-open period. If 1,000 attendees are registered and doors open one hour before scheduled content, an erroneous uniform distribution assumes an arrival rate of 16.6 attendees per minute (1,000 divided by 60 minutes). In reality, professional conference crowds do not distribute uniformly.
In almost every case, a sharp peak surge occurs: 60% to 70% of attendees arrive within a narrow 20- to 30-minute window immediately preceding the formal opening remarks or breakfast service.
Calculating the Event Check-In Stations Peak Arrival Rate
To determine the actual throughput that scanning points must absorb, apply the peak flow formula:
$$text{Peak Arrival Rate} = frac{text{Total Attendees} times text{Peak Ratio}}{text{Peak Window (Minutes)}}$$
For example, consider a conference with 1,200 attendees where 65% of the audience is expected to arrive within a 25-minute window:
- Peak audience volume: 780 attendees
- Required intake rate: 31.2 attendees per minute
If your intake setup can only process 15 attendees per minute, a backlog forms immediately, compounding wait times with every passing minute.
—
2. Per-Attendee Service Time
The second bottleneck is service time: the duration required for a staff member or a self-service kiosk to complete a single identification and check-in cycle. Service time comprises three main components:
- Retrieving credentials or QR codes: An attendee searching an inbox or messaging app at the front of the line consumes critical seconds.
- Scanning and verification: Hardware and software processing times conforming to the ISO/IEC 18004 standard for fast optical barcode decoding.
- Handing out badges or event collateral: On-demand badge printing adds between 6 and 15 seconds per person.
| Check-In Workflow | Average Time per Attendee | Station Throughput (per minute) |
|---|---|---|
| Digital QR scan only (fast-track) | 4–6 seconds | 10–12 attendees |
| QR scan + pre-printed lanyard distribution | 8–12 seconds | 5–7 attendees |
| Manual name search in a spreadsheet | 20–35 seconds | 2–3 attendees |
| QR scan + on-demand thermal badge print | 15–20 seconds | 3–4 attendees |
Manual lookups in a spreadsheet reduce intake capacity by up to 75% compared to dedicated QR validation sent ahead of time. Switching to barcode or QR scanning immediately cuts the physical station footprint required at the venue.
—
3. Buffer Margins and Exception Handling
Operational disruptions will happen on-site: missing confirmation emails, misspelled names, last-minute ticket transfers, or venue Wi-Fi instability. If a staff member at a primary check-in lane attempts to troubleshoot an individual registration failure, that lane stops completely, creating an immediate queue.
Dedicated Help Desk Separation
The most important operational rule is architectural segregation: primary check-in stations handle uninterrupted flow only. Any issue requiring more than 5 seconds of intervention must be redirected to a dedicated help desk situated several meters away from the main access corridor. This preserves throughput for all remaining guests.
Handling Connectivity Outages
Cellular network congestion and dead zones in basement ballrooms are common failure modes. Production-grade registration systems must implement resilient client-side caching and offline-first data structures, using web standards such as the Service Worker API to scan and authenticate check-ins locally during intermittent cloud connectivity disconnects.
—
How to Calculate Event Check-In Stations: The Final Formula
Factoring in all variables yields the required number of scanning stations ($N$):
$$N = frac{text{Peak Arrival Rate}}{text{Capacity per Station}} times 1.2$$
The 1.2 safety factor accounts for micro-delays, staff handovers, and physical movement buffers.
For instance, given a peak rate of 30 attendees per minute and a station handling badge handoff at 6 attendees per minute:
- 30 divided by 6 = 5 stations
- Applying the 20% safety margin (5 × 1.2) = 6 active check-in stations
Calculating your station count and designing fallback lanes before opening doors guarantees smooth crowd flow and protects the attendee experience. If you are structuring entrance logistics for an upcoming summit or enterprise conference, reach out to our engineering team to review your technical registration architecture and throughput requirements.
Keep reading

WhatsApp Event Ticket Delivery: Strategic Timing for Seamless Check-In
Deliver WhatsApp event tickets two hours before start time to eliminate check-in queues, prevent email searches, and streamline on-site operations.

Instant Event Attendance Report: How to Wrap Up B2B Conferences Without Spreadsheet Chaos
Generate an instant event attendance report without manual spreadsheets. Learn how real-time cloud check-in delivers branded client reports in minutes.

Real-Time Attendance Tracking: Live Event Control and Zone Access
Learn how real-time attendance tracking and WebSocket sync enable live crowd control, zone management, and frictionless enterprise event operations.