
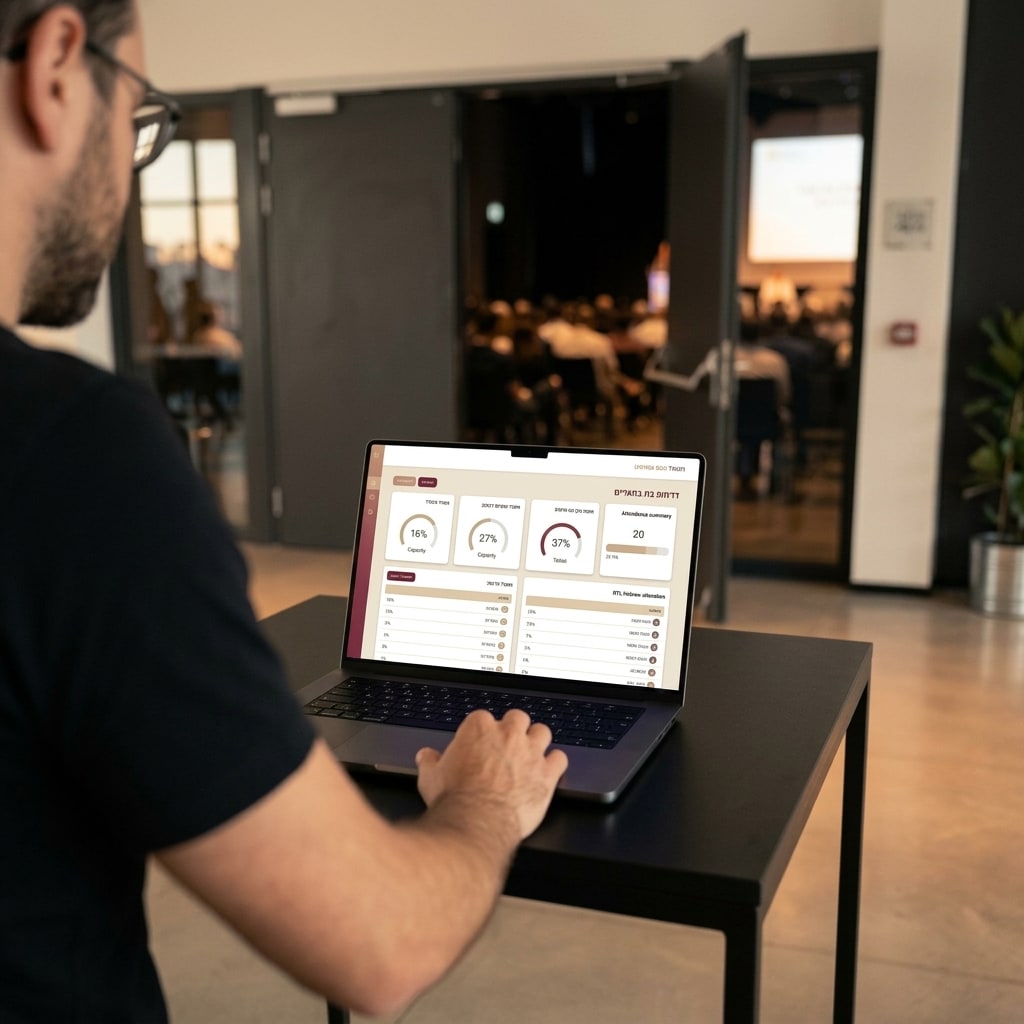
An event attendance report can be generated instantaneously at the close of a business conference by maintaining continuous, bi-directional cloud synchronization between on-site check-in scanners and a centralized management database. A digital attendance report is a verified data document consolidating entry timestamps, attendee category breakdowns, and actual arrival percentages derived directly from access-control scans. By streaming every check-in event to a single source of truth in real time, operational directors and event organizers can hand a fully reconciled, branded report to executive stakeholders before the closing keynote finishes.
At corporate summits, industry congresses, and company retreats, the official end of an event is traditionally when the most frustrating administrative work begins. Instead of concluding an event on an operational high note, account managers and logistics leads often find themselves staring at disparate spreadsheet exports. Reconciling manual guest additions, cross-checking who was admitted through secondary venue doors, and reconciling caterer headcounts against the initial registration list wastes critical hours and introduces human error.
—
The Spreadsheet Trap: Why Post-Event Data Consolidation Becomes a Bottleneck
Managing attendee credentials and attendance figures across disconnected spreadsheets creates a systemic failure caused by fragmented sources of truth. Throughout a corporate production, guest rosters undergo constant, last-minute revisions: attendees update dietary requirements, organizations swap delegate names via email, and VIP registrations arrive minutes before the opening session.
When check-in stations run on isolated offline files or paper lists, access data fragments across every physical entrance. Consolidating that fragmented data into an authoritative post-event summary requires operational teams to undertake a tedious, multi-step process:
- Physical or digital file retrieval from every tablet, terminal, and handheld barcode scanner distributed throughout the venue.
- Deduplication and conflict resolution, resolving handwritten check-ins entered by door staff and identifying anomalous or corrupted rows.
- Data structure normalization, aligning field encodings and delimiter structures to formal standards such as the RFC 4180 standard for CSV exports to prevent character corruption and broken field delimiters.
- Manual data visualization, constructing custom charts for hourly arrival curves, badge distributions, and segment metrics to present an executive-level summary.
This reconciliation cycle routinely burns two to five hours of skilled production labor. Worse, it delays client reporting by days, forfeiting communication momentum during the immediate post-event window when client attention and engagement are at their absolute peak.
—
Real-Time Synchronization Architecture: The Technology Behind Instant Reports
The architectural foundation required to deliver an instantaneous event attendance report is an event-driven, real-time database cluster. Rather than caching scans into local flat files on individual terminals, each badge scan or QR-code transaction triggers an authenticated HTTPS payload to a central cloud controller.
The cloud controller processes each incoming scan against global attendance records, logs the transaction alongside a microsecond-accurate timestamp compliant with the ISO 8601 standard, and broadcasts updated state to all connected terminals. This architectural pattern prevents ticket reuse across multiple turnstiles and ensures that every terminal reflects identical system state.
To withstand venue connectivity drops or saturated cellular infrastructure, production terminals employ a resilient local caching layer with conflict-free replication. If internet connectivity drops, the scanning engine validates tickets against its local indexed state without interruption. When network connectivity resumes, the station syncs all queued records upstream without missing data fields or requiring operator intervention. Before opening event doors, teams should run the network diagnostics detailed in 3 mandatory checks before doors open: an operational checklist for event producers to verify scanner latency and database health.
—
Core Metrics Corporate Stakeholders Expect in an Event Attendance Report
Corporate event directors, procurement teams, and marketing executives do not want raw, unparsed tables of names. They require concrete operational and financial performance indicators that substantiate event investment, validate vendor deliverables, and guide capacity planning for future summits.
| Required Metric | Business Impact for the Client | Operational Utility for Future Productions |
|---|---|---|
| Overall Show-Up Rate | Ratio of confirmed RSVP registrations to verified scans | Direct calibration of catering orders, seating layouts, and venue capacity |
| Peak Arrival Curve | Attendee throughput mapped across 15-minute intervals | Data-driven staffing allocations and lane scaling during peak entry windows |
| Tiered Badge Breakdown | Verified turnout across VIPs, general attendees, media, and sponsors | Sponsor ROI verification and executive delegate tracking |
| Organizational Distribution | Attendance volume segmented by company, branch, or department | Internal compliance tracking and corporate stakeholder engagement audits |
Accurate throughput modeling is critical to smoothing arrival curves and avoiding bottlenecks at the perimeter. For detailed lane modeling methods, consult our guide on how to calculate event check-in stations: 3 rules to prevent peak-hour queues.
—
Conference Reporting Workflows and Branded Executive Summaries
To function as an executive-level deliverable, an attendance document must move beyond unstyled raw data. Modern corporate reporting translates live transactional logs into an automated, branded executive PDF or interactive stakeholder dashboard, structured into four components:
- Executive Performance Summary: High-level summary cards displaying total registrations, total unique arrivals, peak arrival window, and final arrival percentage.
- Arrival Velocity Chart: A standardized time-series bar chart illustrating entry velocity from initial door opening through the start of the keynote session.
- Segment and Status Breakdown: Proportional distribution charts separating pre-registered guests, walk-in attendees, and no-shows.
- Audit and Override Log: A transparent operational log accounting for manual credential overrides, on-site attendee replacements, and desk-level registrations.
—
The Operational Chain: From Mobile Credentials to Final Documentation
The integrity of an attendance report depends on the initial ticketing and credentialing architecture. When registration, pass delivery, and on-site access control operate within an integrated pipeline, attendance records populate passively as a byproduct of entry.
Deploying smart credential distribution eliminates manual name lookups at the desk. Issuing passes compatible with Apple Wallet and Google Wallet accelerates terminal throughput, as outlined in our analysis on wallet-based tickets: how digital credentials eliminate entry queues. Furthermore, coordinating automated messaging schedules prevents entrance confusion and ensures delegates have barcodes open upon arrival, a workflow explained in our guide to WhatsApp ticket delivery timing for frictionless event entry.
Because each credential scan logs instantly to the unified cloud backend, event operators never need to run post-hoc cleanup scripts. Clicking export produces an executive PDF ready for immediate presentation.
—
Resolving Operational Edge Cases That Corrupt Attendance Data
Live corporate summits present unpredictable on-site scenarios that disrupt reporting if not handled by software logic:
- Unregistered Walk-In Guests: Operational teams process unannounced attendees through a dedicated walk-in interface. The system flags these entries as on-site registrations, ensuring the post-event summary reflects the exact delta between baseline RSVPs and real-world attendance.
- Delegate Substitutions: When a corporate client swaps an absent delegate for a colleague, on-site staff update record metadata without creating duplicate rows or overwriting the original transaction history.
- Multi-Door Ingress and Egress: At multi-stage conventions featuring off-site meal breaks or re-entry, the software logs first-touch arrivals separately from access-control timestamps, preserving clean headline attendance figures while tracking real-time venue occupancy.
Handling these edge cases within the access infrastructure protects project margins and eliminates billing disputes over food-and-beverage reconciliations, badge allotments, and venue licensing.
To discover how modern check-in infrastructure can streamline your next corporate event and deliver instant executive reports, get in touch with our engineering team.
Common questions
How fast can an event attendance report be delivered after an event concludes?
An event attendance report is generated instantaneously with a single click inside the central admin console. Because scanning terminals update a cloud database in real time using persistent connections, there is no need to retrieve physical devices or reconcile offline spreadsheets. A complete, branded PDF summary and raw CSV data are available for download the moment entry gates close.
What happens to attendance tracking if the venue internet connection fails?
The scanning terminals operate on a resilient hybrid architecture using local SQLite caching on each physical device. If network connectivity drops, terminals continue verifying passes, recording check-in timestamps, and admitting attendees without disruption. As soon as cellular or Wi-Fi connectivity returns, the queued records automatically sync to the cloud database with exact timestamps preserved.
Can the final attendance report differentiate between pre-registered guests and walk-in arrivals?
Yes. The system automatically categorizes attendees by registration source, separating pre-registered guests from on-site walk-ins. The final attendance report itemizes each cohort independently, displaying entry timestamps, the operator terminal used for on-site registration, and specific ticket tiers. This segmentation provides financial clarity when reconciling vendor costs, badge inventory, and per-head catering charges.
In what file formats can the client attendance report be exported?
The attendance summary is exported in two distinct formats. Clients receive a branded, executive-ready PDF report containing high-level performance cards, arrival velocity charts, and demographic breakdowns suitable for executive presentation. Simultaneously, operations teams can export complete, unsummarized CSV or Excel datasets containing individual delegate timestamps, custom registration attributes, and terminal audit logs.
From the blog
Keep reading

Digital Wallet Event Tickets: How Mobile Passes Eliminate Entrance Queues
Learn how digital wallet event tickets in Apple and Google Wallet eliminate entrance queues through automated lock-screen triggers and offline reliability.

WhatsApp Event Ticket Delivery: Strategic Timing for Seamless Check-In
Deliver WhatsApp event tickets two hours before start time to eliminate check-in queues, prevent email searches, and streamline on-site operations.

Real-Time Attendance Tracking: Live Event Control and Zone Access
Learn how real-time attendance tracking and WebSocket sync enable live crowd control, zone management, and frictionless enterprise event operations.